Drop-off analysis shows where users go after leaving a specific funnel step. It visualizes post-drop-off behavior so you can see how users move through (or away from) your intended journey.
Go to a Funnels dashboard.
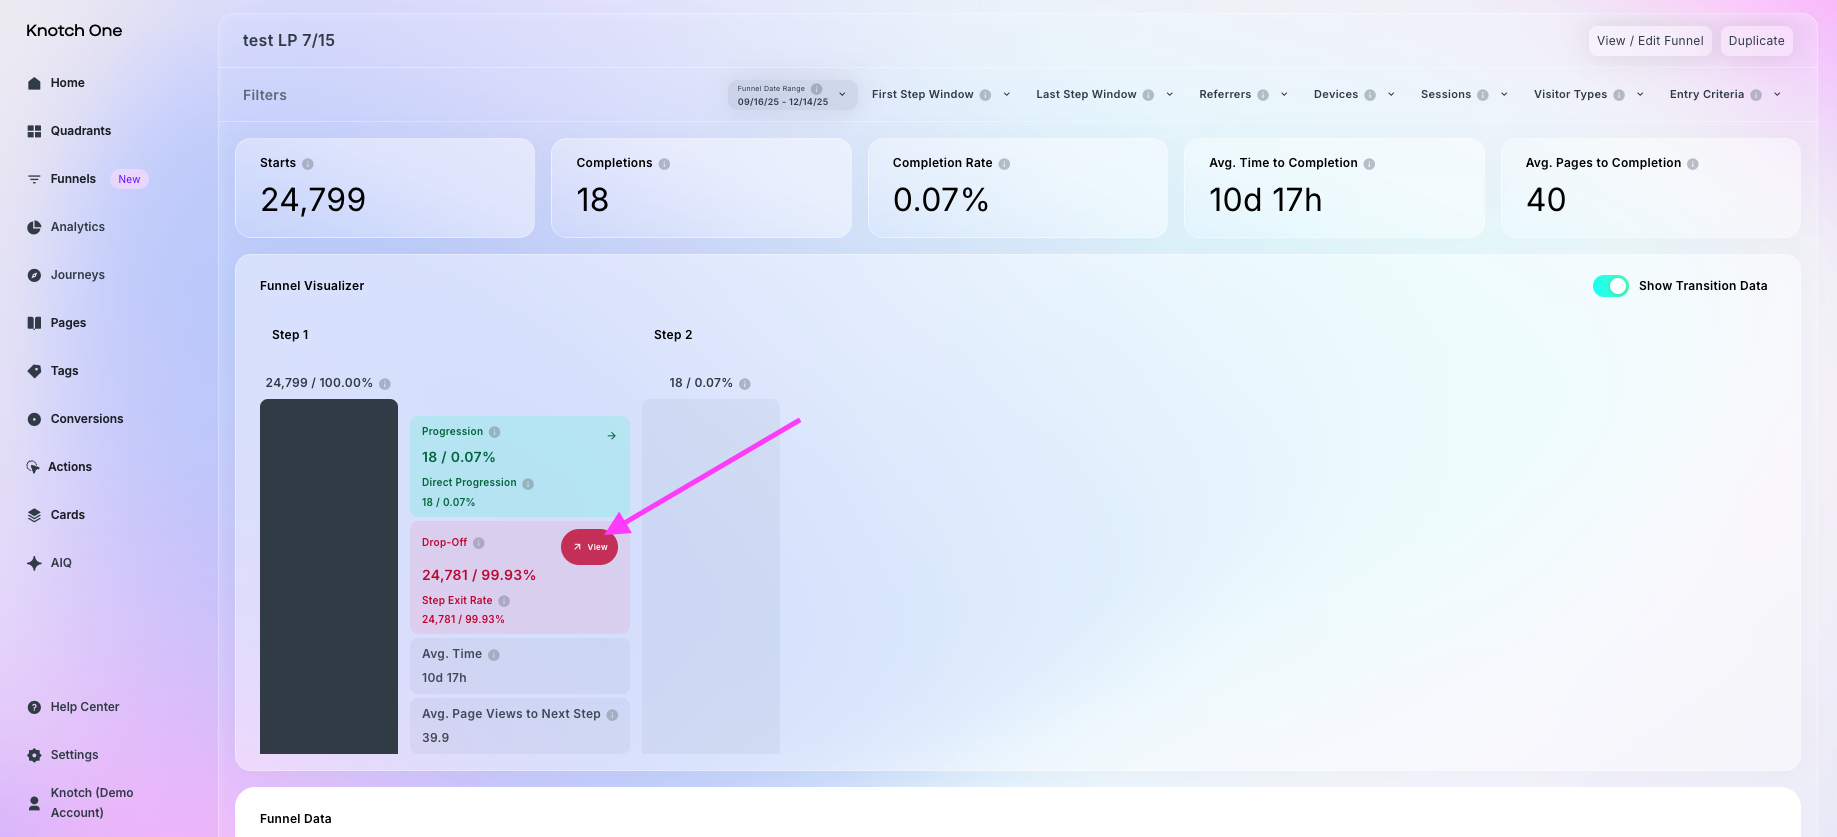
In the Funnel Visualizer chart, find the Drop-off section for a step.
Hover over View, then click View Analysis.
On the left, you’ll see a Sankey chart mapping user movement after the selected step. These are listed in order from most to fewest visitors. Here are a few terms we use in the Drop-off Analysis chart:
Next Steps: pages users visited immediately after leaving that funnel step.
Immediate Exit: users who left the website right after that funnel step.
Pathways: see the rest of the path that users took after Next Steps.
Use the Drop-off Analysis Chart view to identify common detours and prioritize fixes on the pages drawing users away.
On the right of Drop-off Analysis, you’ll see a Next Steps list, which displays the same destinations in a detailed table view. The Drop-off Analysis Next Step list columns include:
Next Step — the pages users visited immediately after this funnel step.
Visitors — the number and percentage of visitors who reached this page within the pathway.
Average Scroll Depth — average percentage of the page that visitors scrolled through.
Average Time on Page — average amount of time visitors spend on this page before moving to another page or exiting the site.
Recirculation Rate — the percentage of visitors who navigated to another page on your site after viewing this page.
Exit Rate — the percentage of users who left your site entirely after visiting this page.
You can search within this list to find specific pages or download it as a CSV for further analysis.
By revealing post-drop-off behavior, you can target friction points, streamline page flow, and keep more users moving toward conversion. Dive into detailed tables or export the data to prioritize site updates and guide visitors back into the funnel.
